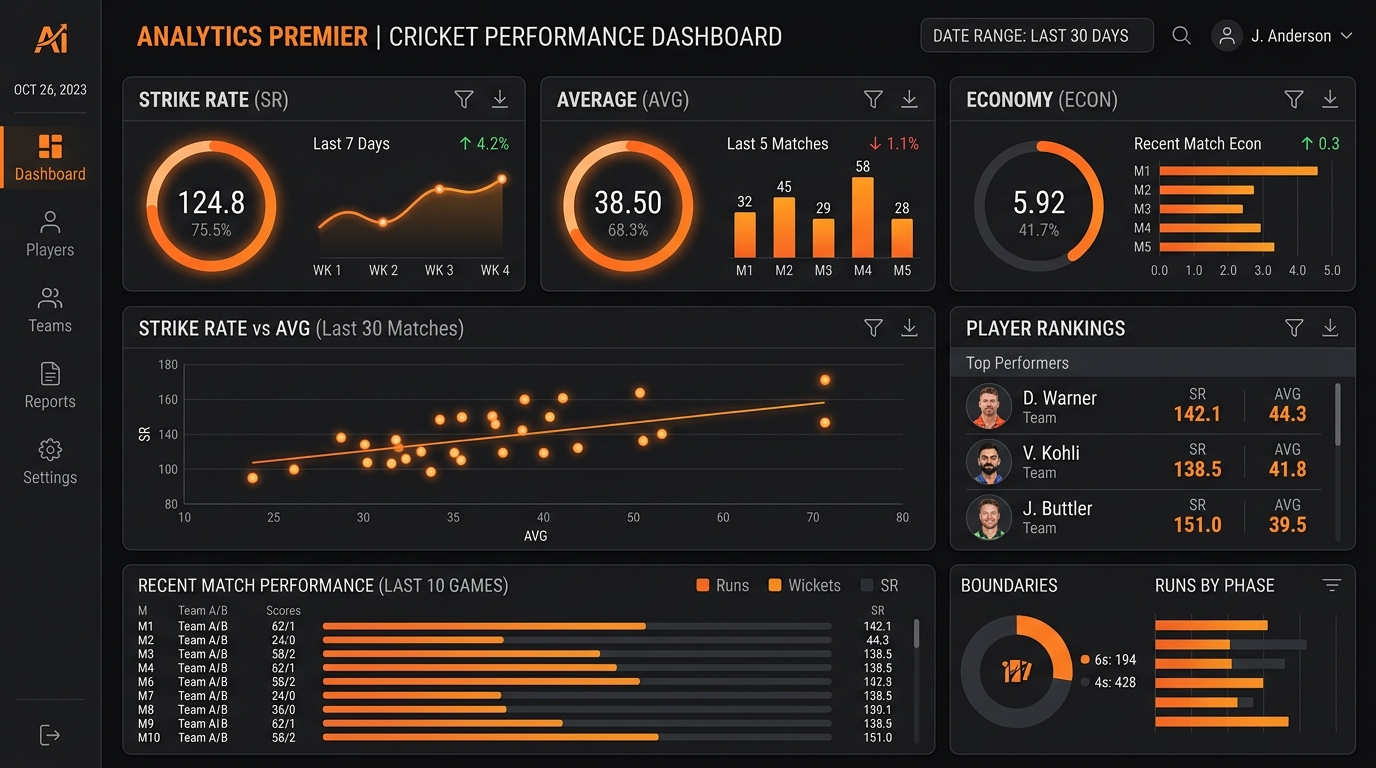
Cricket is a sport of numbers, and a handful of stats explain most of what is happening on the field. You do not need to be a statistician — just understanding a few key measures will make commentary clearer and help you judge whether a player or team is doing well. All the examples below use simple, made-up numbers purely to show the maths.
Batting stats
Batting average
A batter's average is the total runs they have scored divided by the number of times they have been out. It reflects how many runs they typically contribute per dismissal. For example, 500 runs for 10 dismissals gives an average of 50. A higher average suggests greater consistency, though it does not tell you how quickly those runs came.
Strike rate
Strike rate measures scoring speed: runs scored per 100 balls faced, calculated as (runs ÷ balls) × 100. If a batter makes 60 from 40 balls, the strike rate is 150. In T20, a high strike rate is often more valuable than a high average, because there are so few overs. In Tests, a steady average usually matters more than speed.

Bowling stats
Economy rate
Economy rate is the average number of runs a bowler concedes per over. If a bowler gives away 32 runs in 4 overs, the economy is 8.0. A lower economy means the bowler is harder to score off — especially prized in limited-overs cricket and the death overs.
Bowling average and strike rate
A bowler's average is runs conceded per wicket taken — lower is better. A bowler's strike rate is the number of balls bowled per wicket — again, lower is better, because it means they take wickets more often. Together these show whether a bowler is containing runs, taking wickets, or both.
Team stats
Run rate
Run rate is the runs scored per over across an innings. If a team scores 90 in 12 overs, the run rate is 7.5. It is the quickest way to judge whether an innings is going fast or slow.
Required run rate
In a chase, the required run rate is the runs per over the batting side still needs to win. As the chase progresses, comparing the current run rate with the required run rate tells you instantly who is ahead. A required rate that keeps climbing signals mounting pressure.
Why these stats help you follow a match
Stats turn a scoreboard into a story. A low economy rate in the powerplay explains why a chase is struggling; a soaring required run rate explains why a batting side is taking risks. They also underpin many cricket markets — particularly the session and fancy markets covered in our markets guide. That said, stats describe the past and present; they never guarantee the future. A brilliant average does not promise runs today, and a great economy can be undone by one bad over. Use numbers as a guide, not a certainty. Context matters too — a strike rate that looks modest in a flat-pitch run feast might be excellent on a difficult, turning surface, so always read a number against the conditions it was made in. If any term here is unfamiliar, our cricket glossary can help.
Frequently asked questions
Is a high batting average or strike rate more important?
It depends on the format. Strike rate matters more in T20, where overs are scarce; a steady average matters more in Tests, where time is plentiful.
What counts as a good economy rate?
Lower is better, but what is "good" varies by format and situation. Containing runs in the death overs is far harder than in the middle overs.
What is net run rate?
A tie-breaker used in league tables that reflects how heavily a team has won or lost across a tournament, factoring in runs scored and conceded.
Do stats predict the future?
No. They describe past and present performance only. A great record never guarantees what a player or team will do on the day.
Key takeaways
- Batting average = runs per dismissal; strike rate = runs per 100 balls.
- Economy rate = runs conceded per over; lower is better for bowlers.
- Run rate and required run rate show who is ahead in a chase.
- Stats explain the game but never guarantee what happens next.
Stats are useful context, not a prediction. No number removes the uncertainty of sport. If you bet, do so as an adult within a budget and never chase losses.
See the stats come alive
Numbers mean more when you watch them change in real time. See how live cricket works on FairPlay.
Explore FairPlay Live